ggplot2 ISU palette
To make figures in R using ggplot2 that use Iowa State University colors, you can follow these instructios and construct the palette using ISU colors.
First we need to construct the palette
library(ggplot2)

ISU_primary_palette   <- c("#C8102E", "#F1BE48", "#524727",
                           "#9B945F", "#CAC7A7")

ISU_secondary_palette <- c("#3E4827", "#76881D", "#A2A569",
                           "#003D4C", "#006BA6", "#7A99AC",
                           "#7C2529", "#9A3324", "#BE531C",
                           "#8B5B29", "#B9975B", "#EED484",
                           "#6E6259", "#707372", "#ACA39A")
Then, we need to construct the plot. For demonstration purposes, I use a bar chart, but generally I would not be using a bar chart. Here is a bar chart using the primary palette.
n_primary <- length(ISU_primary_palette)

# Name the palette
groups <- paste("group", 1:n_primary, sep="")
names(ISU_primary_palette) <- groups

d <- data.frame(group = groups, value = runif(n_primary))

ggplot(d, aes(x = group, y = value, fill = group)) +
  geom_bar(stat="identity") +
  scale_fill_manual(values = ISU_primary_palette) +
  theme_bw()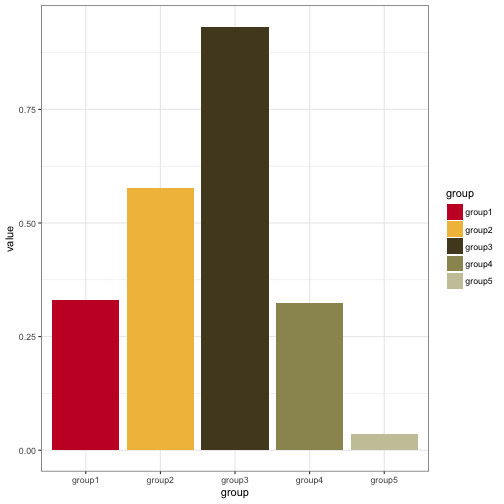
Here is a bar chart using the secondary palette.
n_secondary <- length(ISU_secondary_palette)

# Name the palette
groups <- paste("group", 1:n_secondary, sep="")
names(ISU_secondary_palette) <- groups

d <- data.frame(group = factor(groups, levels = groups),
                value = runif(n_secondary))

ggplot(d, aes(x = group, y = value, fill = group)) +
  geom_bar(stat="identity") +
  scale_fill_manual(values = ISU_secondary_palette) +
  theme_bw()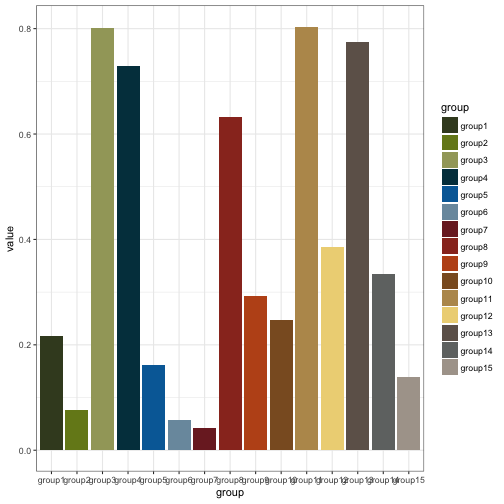
This post makes me think that I should just create an R package that has the color palette.
blog comments powered by Disqus