Data: raw vs derived vs tidy
In data management there is a key concept about different types of data. Today, I want to talk about a categorization of the data into three categories: raw, derived, and tidy.
Raw data
Raw data are the data as they recorded. Raw data can be either written or digital.
The figure below shows an example of raw, written data for gas consumption.
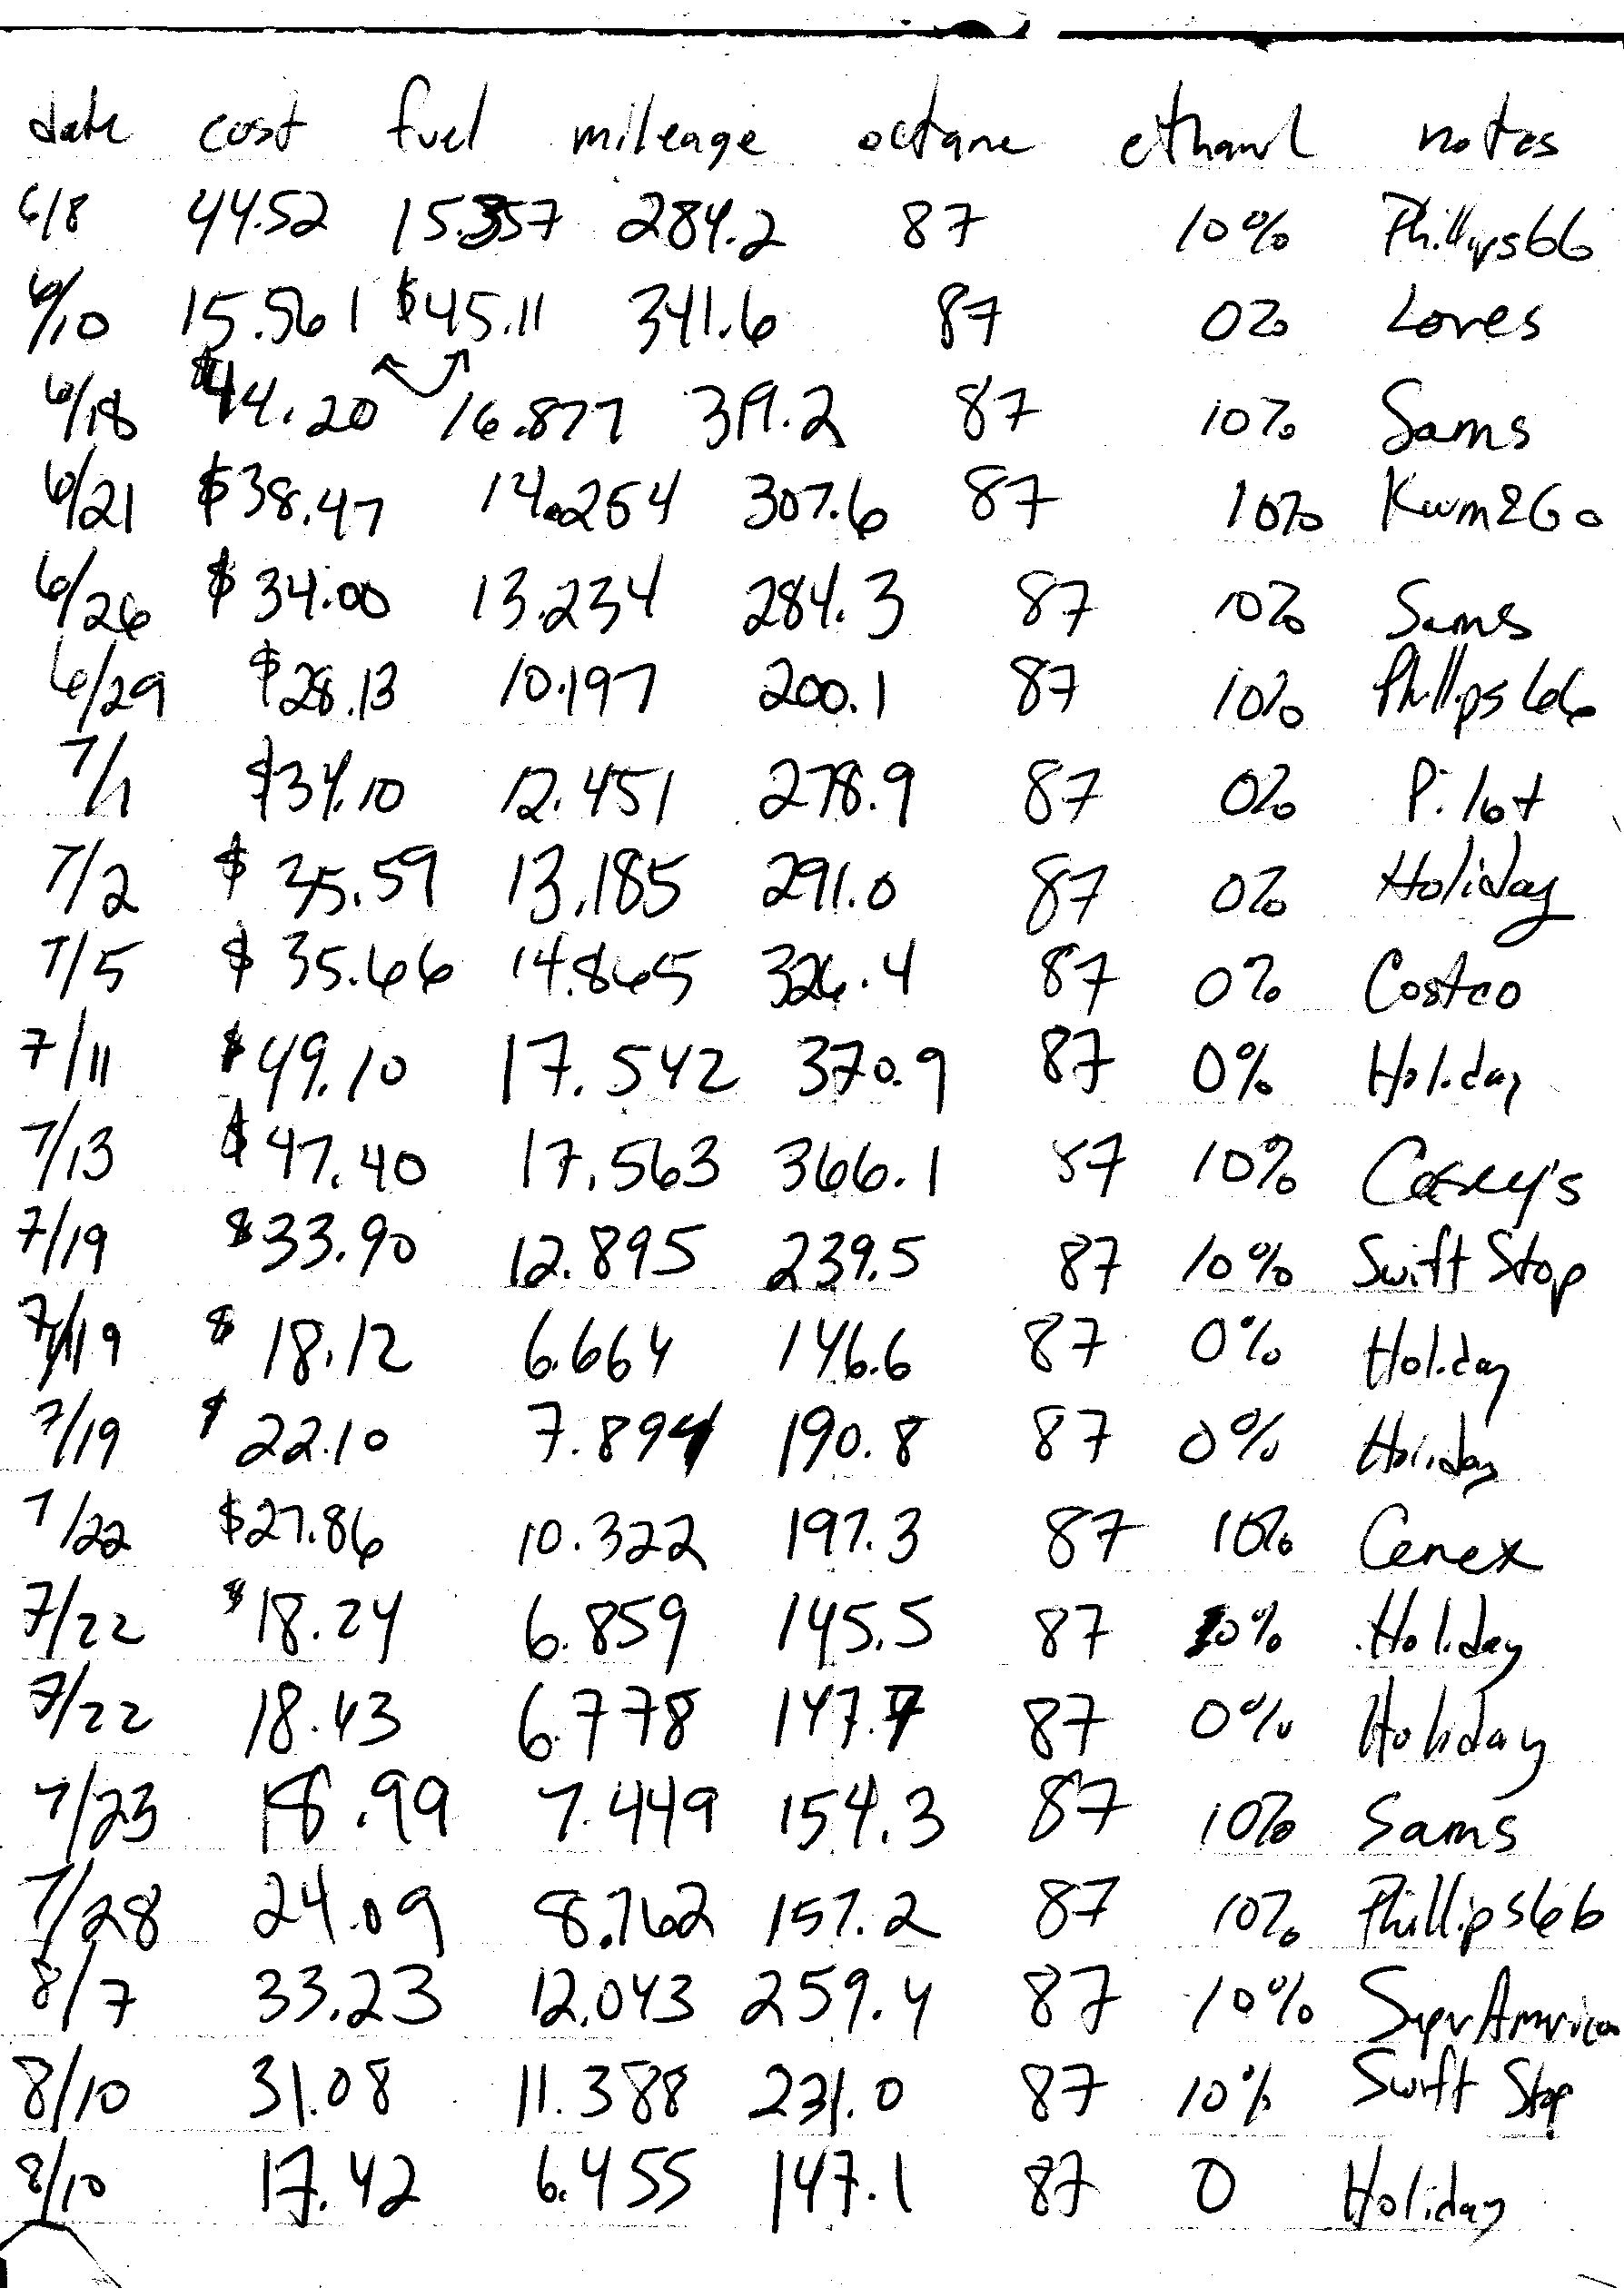
These data are then digitized in, as shown here.
While these are both raw data, the latter is a digitized version of the former.
Raw data are the foundation based on which the rest of the data management structure is constructed. We need to ensure the raw data are sound for the rest of the structure to stand. For the raw data to be sound, it needs to be
- free from errors
- consistent in its formatting
When errors are discovered in raw data, they should be fixed and log should be included when changes are made.
Since each file of raw data, like the gas consumption above, is one file of a much larger collection of raw data files, the formatting of each individual file needs to be consistent in order to enable collating via scripts. So, the raw data should have consistent column names (including capitalization), column order, units, etc.
In addition, each individual piece of raw data should only be recorded once. For example, all observations in a single file have the same year. Rather than having a column called year, or a column with year-month-day, where the year would simply be repeated for every row, we decided to encode the year into the file name. The filename for these files are the YYYYMMDD for the first observation with an .csv extension for the digitized version and a .png (or .pdf) extension for a scan of the data sheet.
Derived data
Derived data are any data that are obtained from the raw data including collating, joining, unit conversion, etc. Derived data should be constructed using scripts, rather than copying-and-pasting or formulas in Excel, so that when errors in raw data are fixed, they can be easily propagated to the derived data.
In the gas consumption example above, there are 18 similar files and each csv file has the date of the first observation as the filename. A script is used to extract the year from the filename, combine this year with the month and day in the first column of the csv file to construct a new column that is an actual date, and then combine all 18 of these files together into one larger file.
Tidy data
Tidy data is a specific format of derived data that is suitable for statistical analysis including graphical and tabular displays as well as more sophisticated statistical modeling. Tidy data has one observation per row with all variables related to this observation in columns.
The gas consumption data is already formatted as one observation per row, but not all variables are in the columns. In particular, year is in the filename and thus to make this data tidy, we needed to read the year from the filename and place it a column.
Keep raw data separate
Raw data should not be mixed with derived data to reduce the chance of errors. Once constructed, raw data should only be read from (unless an error needs to be fixed).
blog comments powered by Disqus