Simulating spatial data
The posts generates some spatial data on a lattice which can be used to evaluate
areal models or point-referenced models on a lattice.
The code is a modified version of the code in ?CARBayes::S.CARleroux.
library("MASS")
library("dplyr")
## Warning: package 'dplyr' was built under R version 3.4.2##
## Attaching package: 'dplyr'## The following object is masked _by_ '.GlobalEnv':
##
## slice## The following objects are masked from 'package:Hmisc':
##
## combine, src, summarize## The following object is masked from 'package:MASS':
##
## select## The following objects are masked from 'package:plyr':
##
## arrange, count, desc, failwith, id, mutate, rename, summarise,
## summarize## The following objects are masked from 'package:stats':
##
## filter, lag## The following objects are masked from 'package:base':
##
## intersect, setdiff, setequal, unionlibrary("ggplot2")
set.seed(20171108)
sessionInfo()## R version 3.4.1 (2017-06-30)
## Platform: x86_64-apple-darwin15.6.0 (64-bit)
## Running under: OS X El Capitan 10.11.6
##
## Matrix products: default
## BLAS: /System/Library/Frameworks/Accelerate.framework/Versions/A/Frameworks/vecLib.framework/Versions/A/libBLAS.dylib
## LAPACK: /Library/Frameworks/R.framework/Versions/3.4/Resources/lib/libRlapack.dylib
##
## locale:
## [1] en_US.UTF-8/en_US.UTF-8/en_US.UTF-8/C/en_US.UTF-8/en_US.UTF-8
##
## attached base packages:
## [1] stats graphics grDevices utils datasets methods base
##
## other attached packages:
<<<<<<< Updated upstream
## [1] dplyr_0.7.4 xtable_1.8-2 Hmisc_4.0-3
## [4] Formula_1.2-2 survival_2.41-3 lattice_0.20-35
## [7] MCMCpack_1.4-0 MASS_7.3-47 coda_0.19-1
## [10] dlm_1.1-4 ggplot2_2.2.1.9000 plyr_1.8.4
## [13] knitr_1.17
##
## loaded via a namespace (and not attached):
## [1] reshape2_1.4.2 splines_3.4.1 colorspace_1.3-2
## [4] htmltools_0.3.6 base64enc_0.1-3 rlang_0.1.2
## [7] foreign_0.8-69 glue_1.1.1 RColorBrewer_1.1-2
## [10] bindrcpp_0.2 bindr_0.1 stringr_1.2.0
## [13] MatrixModels_0.4-1 munsell_0.4.3 gtable_0.2.0
## [16] htmlwidgets_0.9 evaluate_0.10.1 labeling_0.3
## [19] latticeExtra_0.6-28 SparseM_1.77 quantreg_5.33
## [22] htmlTable_1.9 highr_0.6 Rcpp_0.12.13
## [25] acepack_1.4.1 scales_0.5.0.9000 backports_1.1.1
## [28] checkmate_1.8.4 mcmc_0.9-5 gridExtra_2.3
## [31] digest_0.6.12 stringi_1.1.5 grid_3.4.1
## [34] tools_3.4.1 magrittr_1.5 lazyeval_0.2.0
## [37] tibble_1.3.4 cluster_2.0.6 pkgconfig_2.0.1
## [40] Matrix_1.2-11 data.table_1.10.4 assertthat_0.2.0
## [43] R6_2.2.2 rpart_4.1-11 nnet_7.3-12
## [46] compiler_3.4.1
=======
## [1] knitr_1.17 ggplot2_2.2.1 bindrcpp_0.2 dplyr_0.7.4 CARBayes_5.0
## [6] Rcpp_0.12.13 MASS_7.3-47
##
## loaded via a namespace (and not attached):
## [1] gtools_3.5.0 spam_2.1-1 splines_3.4.0
## [4] lattice_0.20-35 colorspace_1.3-2 expm_0.999-2
## [7] htmltools_0.3.6 yaml_2.1.14 MCMCpack_1.4-0
## [10] rlang_0.1.2 foreign_0.8-69 glue_1.1.1
## [13] sp_1.2-5 bindr_0.1 plyr_1.8.4
## [16] stringr_1.2.0 MatrixModels_0.4-1 dotCall64_0.9-04
## [19] CARBayesdata_2.0 munsell_0.4.3 gtable_0.2.0
## [22] coda_0.19-1 evaluate_0.10.1 labeling_0.3
## [25] SparseM_1.77 quantreg_5.33 spdep_0.6-13
## [28] backports_1.1.0 scales_0.4.1 gdata_2.18.0
## [31] truncnorm_1.0-7 deldir_0.1-14 mcmc_0.9-5
## [34] digest_0.6.12 stringi_1.1.5 gmodels_2.16.2
## [37] grid_3.4.0 rprojroot_1.2 tools_3.4.0
## [40] LearnBayes_2.15 magrittr_1.5 lazyeval_0.2.0
## [43] tibble_1.3.4 tidyr_0.6.3 pkgconfig_2.0.1
## [46] Matrix_1.2-10 shapefiles_0.7 matrixcalc_1.0-3
## [49] assertthat_0.2.0 rmarkdown_1.6 R6_2.2.2
## [52] boot_1.3-20 nlme_3.1-131 compiler_3.4.0
>>>>>>> Stashed changesConstruct spatial lattice.
Grid <- expand.grid(x.easting = 1:10, x.northing = 1:10)
n <- nrow(Grid)
Simulate data
# Explanatory variables and coefficients
x1 <- rnorm(n) %>% round(2)
x2 <- rnorm(n) %>% round(2)

# Spatial field
distance <- as.matrix(dist(Grid))
omega <- MASS::mvrnorm(n     = 1,
                       mu    = rep(0,n),
                       Sigma = 0.4 * exp(-0.1 * distance))

eta <- x1 + x2 + omega

d <- Grid %>%
  mutate(Y_normal = rnorm(n, eta, sd = 0.1) %>% round(2),
         Y_pois   = rpois(n, exp(eta)),
         trials   = 10,
         Y_binom  = rbinom(n = n, size = trials, prob = 1/(1+exp(-eta))),
         x1       = x1,
         x2       = x2)
Spatial surface
ggplot(d %>% mutate(omega=omega),
       aes(x=x.easting, y=x.northing)) +
  geom_raster(aes(fill = omega)) +
  theme_bw()
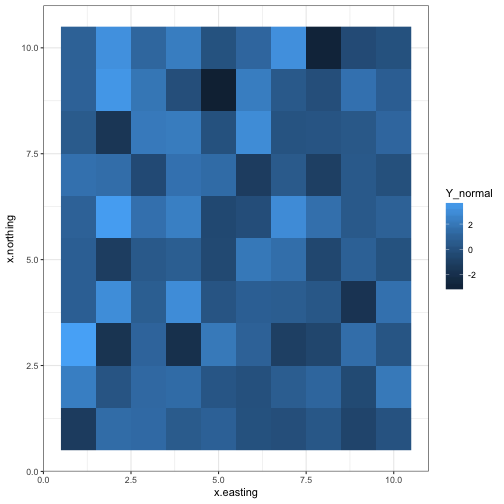
Normal data
ggplot(d, aes(x = x.easting, y = x.northing, fill = Y_normal)) +
  geom_raster() +
  theme_bw()
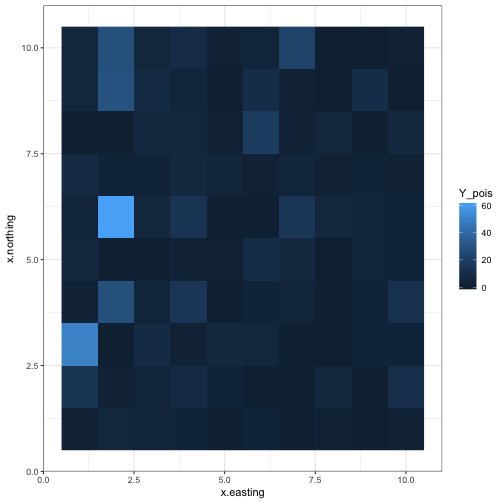
Poisson data
ggplot(d, aes(x = x.easting, y = x.northing, fill = Y_pois)) +
  geom_raster() +
  theme_bw()
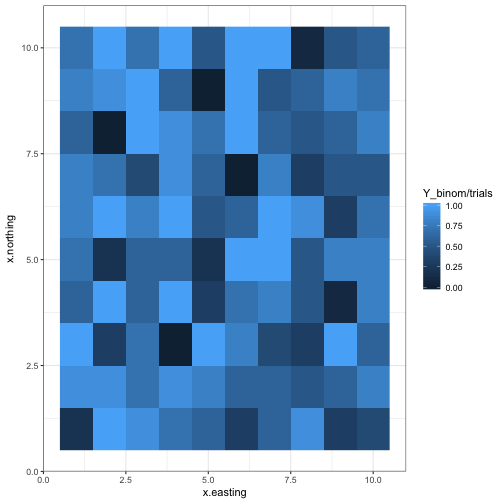
Binomial data
ggplot(d, aes(x = x.easting, y = x.northing, fill = Y_binom/trials)) +
  geom_raster() +
  theme_bw()
For use in future posts.
save(d, file="data/spatial20171108.rda")blog comments powered by Disqus